需要注意的是, pycharts在不同版本进行较大的迭代, 很多参考内容已经过时.
包括其某些官方文档, 大量混乱的文档, 如document
from pyecharts import Map

value = [155, 10, 66, 78]
attr = ["福建", "山东", "北京", "上海"]
map = Map("全国地图示例", width=1200, height=600)
map.add("", attr, value, maptype='china')
map.render()
使用的还是过时的示例, 必须参照的是https://gallery.pyecharts.org/#/README上的文档
这个项目目前看来有点混乱, 提供的文档质量也相当垃圾, 版本间迭代导致前后出现严重的不兼容的情况.
from pyecharts.charts import Map
# from pyecharts.datasets import register_url
import pyecharts.options as opts
# from pyecharts.globals import ChartType
import pandas as pd
# try:
#     register_url("https://echarts-maps.github.io/echarts-countries-js/")
#     print('ok')
# except Exception as error:
#     print(error)
df_a = pd.read_excel("test_map.xlsx")
df_a.head()
# 这里将会导致州这一列的数据被设置为标签
tmp_a = df_a.groupby('order_state').sum()
tmp_a.head()
tmp_a.info()
<class 'pandas.core.frame.DataFrame'>
Index: 50 entries, Alabama to Wyoming
Data columns (total 1 columns):
 #   Column           Non-Null Count  Dtype
---  ------           --------------  -----
 0   sum( quantity )  50 non-null     int64
dtypes: int64(1)
memory usage: 800.0+ bytes
tmp_a.index
Index(['Alabama', 'Alaska', 'Arizona', 'Arkansas', 'California', 'Colorado',
       'Connecticut', 'Delaware', 'Florida', 'Georgia', 'Hawaii', 'Idaho',
       'Illinois', 'Indiana', 'Iowa', 'Kansas', 'Kentucky', 'Louisiana',
       'Maine', 'Maryland', 'Massachusetts', 'Michigan', 'Minnesota',
       'Mississippi', 'Missouri', 'Montana', 'Nebraska', 'Nevada',
       'New Hampshire', 'New Jersey', 'New Mexico', 'New York',
       'North Carolina', 'North Dakota', 'Ohio', 'Oklahoma', 'Oregon',
       'Pennsylvania', 'Rhode Island', 'South Carolina', 'South Dakota',
       'Tennessee', 'Texas', 'Utah', 'Vermont', 'Virginia', 'Washington',
       'West Virginia', 'Wisconsin', 'Wyoming'],
      dtype='object', name='order_state')
tmp_a['sum( quantity )'].max()
4149
# 将参数稍微设置大一点
m_sale = 4200
# 需要将index进行重置
# tmp_a.reset_index(inplace=True)
# data = [tuple(values) for index, values in tmp_a.iterrows()]
# 旧版本的接受的参数是元组
# 新版本改成了列表的形式

# 注意这里的数据类型

temp = [list(e) for e in zip(tmp_a.index, (a[0] for a in tmp_a.values))]
# 数据支持列表("州名称", "数量")
temp
[['Alabama', 137],
 ['Alaska', 36],
 ['Arizona', 490],
 ['Arkansas', 81],
 ['California', 4149],
 ['Colorado', 419],
 ['Connecticut', 238],
 ['Delaware', 67],
 ['Florida', 1319],
 ['Georgia', 438],
 ['Hawaii', 183],
 ['Idaho', 184],
 ['Illinois', 602],
 ['Indiana', 273],
 ['Iowa', 124],
 ['Kansas', 119],
 ['Kentucky', 166],
 ['Louisiana', 130],
 ['Maine', 109],
 ['Maryland', 420],
 ['Massachusetts', 578],
 ['Michigan', 564],
 ['Minnesota', 290],
 ['Mississippi', 60],
 ['Missouri', 266],
 ['Montana', 56],
 ['Nebraska', 71],
 ['Nevada', 228],
 ['New Hampshire', 97],
 ['New Jersey', 708],
 ['New Mexico', 68],
 ['New York', 1378],
 ['North Carolina', 636],
 ['North Dakota', 13],
 ['Ohio', 439],
 ['Oklahoma', 142],
 ['Oregon', 438],
 ['Pennsylvania', 709],
 ['Rhode Island', 63],
 ['South Carolina', 256],
 ['South Dakota', 19],
 ['Tennessee', 255],
 ['Texas', 1463],
 ['Utah', 543],
 ['Vermont', 83],
 ['Virginia', 616],
 ['Washington', 785],
 ['West Virginia', 62],
 ['Wisconsin', 253],
 ['Wyoming', 34]]
# 这里的value

# 务必转为int, 否则后续绘图无法识别value值

type(temp[0][1])
numpy.int64
data = [list(e) for e in zip(tmp_a.index, (int(a[0]) for a in tmp_a.values))]
type(data[0][1])
int
python - What is the difference between native int type and the numpy.int types? - Stack Overflow
There are several major differences. The first is that python integers are flexible-sized (at least in python 3.x). This means they can grow to accommodate any number of any size (within memory constraints, of course). The numpy integers, on the other hand, are fixed-sized. This means there is a maximum value they can hold. This is defined by the number of bytes in the integer (int32 vs. int64), with more bytes holding larger numbers, as well as whether the number is signed or unsigned (int32 vs. uint32), with unsigned being able to hold larger numbers but not able to hold negative number.
So, you might ask, why use the fixed-sized integers? The reason is that modern processors have built-in tools for doing math on fixed-size integers, so calculations on those are much, much, much faster. In fact, python uses fixed-sized integers behind-the-scenes when the number is small enough, only switching to the slower, flexible-sized integers when the number gets too large.
Another advantage of fixed-sized values is that they can be placed into consistently-sized adjacent memory blocks of the same type. This is the format that numpy arrays use to store data. The libraries that numpy relies on are able to do extremely fast computations on data in this format, in fact modern CPUs have built-in features for accelerating this sort of computation. With the variable-sized python integers, this sort of computation is impossible because there is no way to say how big the blocks should be and no consistentcy in the data format.
That being said, numpy is actually able to make arrays of python integers. But rather than arrays containing the values, instead they are arrays containing references to other pieces of memory holding the actual python integers. This cannot be accelerated in the same way, so even if all the python integers fit within the fixed integer size, it still won't be accelerated.
None of this is the case with Python 2. In Python 2, Python integers are fixed integers and thus can be directly translated into numpy integers. For variable-length integers, Python 2 had the long type. But this was confusing and it was decided this confusion wasn't worth the performance gains, especially when people who need performance would be using numpy or something like it anyway.
# 注意这里不能直接使用美国州站点的缩写,(需要使用完整版本的州名称)
map = Map()
# label_opts, 数据标签的显示
map.add("", data, "美国").set_series_opts(label_opts=opts.LabelOpts(
    is_show=True,  # bool
    position='',  # Union[str, Sequence]
    color='',  # Optional[str]
    distance='',  # Union[Numeric, Sequence, None]
    font_size=10,  # Optional[Numeric]
    font_style='',  # Optional[str]
    font_weight='',  # Optional[str]
    font_family='',  # Optional[str]
    rotate=0,  # Optional[Numeric]
    margin=0,  # Optional[Numeric]
    interval='',  # Union[Numeric, str, None]
    horizontal_align='',  # Optional[str]
    vertical_align='',  # Optional[str]
    formatter='{c}',  # Optional[JSFunc]
    background_color='',  # Optional[str]
    border_color='',  # Optional[str]
    border_width=2,  # Optional[Numeric]
    border_radius=2,  # Optional[Numeric]
    rich={},  # Optional[dict]
))
<pyecharts.charts.basic_charts.map.Map at 0x2a018e21790>
map.add("", data, "美国")
<pyecharts.charts.basic_charts.map.Map at 0x2a018e21790>
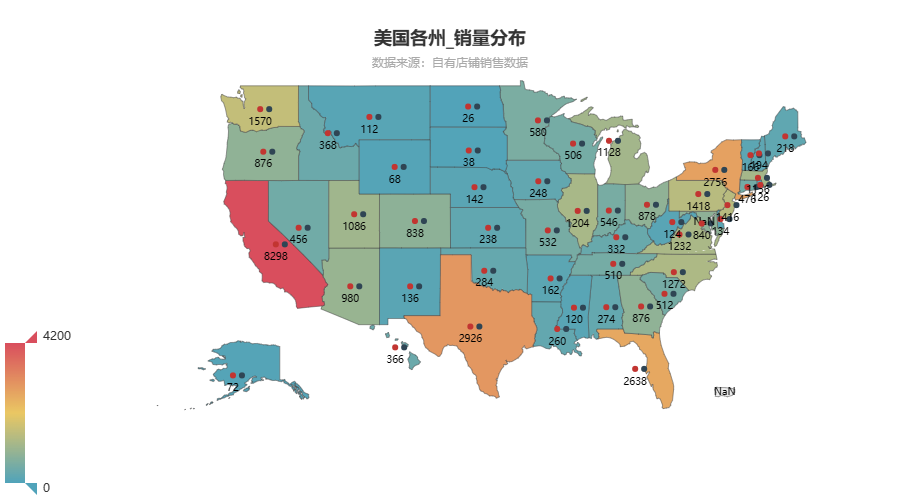
map.set_global_opts(
    title_opts=opts.TitleOpts(
        title="美国各州_销量分布",
        subtitle="数据来源:自有店铺销售数据",
        pos_right="center", pos_top="5%"
    ),
    visualmap_opts=opts.VisualMapOpts(max_=m_sale)
)
<pyecharts.charts.basic_charts.map.Map at 0x2a018e21790>
map.render_notebook()