一. 前言
原名Pandas-profiling, 现在已经更换新的名称, ydata-profiling
文档见: https://ydata-profiling.ydata.ai/docs/master/index.html
pandas-profiling(文档还是老名称) primary goal is to provide a one-line Exploratory Data Analysis (EDA) experience in a consistent and fast solution. Like pandas df.describe() function, that is so handy, pandas-profiling delivers an extended analysis of a DataFrame while alllowing the data analysis to be exported in different formats such as html and json.
该库的目标在于提供类似于pandas的描述性统计的一站式数据概览(EDA)支持.
Key features
- Type inference: automatic detection of columns’ data types (Categorical, Numerical, Date, etc.)
- Warnings: A summary of the problems/challenges in the data that you might need to work on (missing data, inaccuracies, skewness, etc.)
- Univariate analysis: including descriptive statistics (mean, median, mode, etc) and informative visualizations such as distribution histograms
- Multivariate analysis: including correlations, a detailed analysis of missing data, duplicate rows, and visual support for variables pairwise interaction
- Time-Series: including different statistical information relative to time dependent data such as auto-correlation and seasonality, along ACF and PACF plots.
- Text analysis: most common categories (uppercase, lowercase, separator), scripts (Latin, Cyrillic) and blocks (ASCII, Cyrilic)
- File and Image analysis: file sizes, creation dates, dimensions, indication of truncated images and existence of EXIF metadata
- Compare datasets: one-line solution to enable a fast and complete report on the comparison of datasets
- Flexible output formats: all analysis can be exported to an HTML report that can be easily shared with different parties, as JSON for an easy integration in automated systems and as a widget in a Jupyter Notebook.
其相关功能并没什么奇特的地方, 在很多产品上都有类似的功能, 如spss的分析报告的输出. 个人觉得这个库的相关特性应该是借鉴了spss的数据结果输出的模式.

一份常见的spss的结果输出, 包含的内容基本组成, 如下:
- 描述性统计, 数据的概览, 让用户对数据整体的感知.
- 相关的统计方法的结果输出, 主要内容.
- 相关的解释性图表, 主要辅助内容.
二. 简单使用
# 安装
pip install ydata-profiling
使用非常简单, 输出的内容以html文件为载体.
import numpy as np
import pandas as pd
from ydata_profiling import ProfileReport

df = pd.DataFrame(np.random.rand(100, 5), columns=["a", "b", "c", "d", "e"])

# 即可得到相关的分析报告文件
profile = ProfileReport(df, title="Profiling Report")
关键在于这个库和jupyter notebook的联动

支持结果输出的方式.

直接将结果输出到jupyter notebook.
其他使用见上述文档, 没有什么复杂的功能.
具体的使用体验见官方提供的示例.
主要实现:
- 数据的基本情况
- 数据的描述性统计
- 数据的简单分析, 如相关性
- 数据的部分预警提示, 如缺失值, 高度相关性等
- 数据的简单可视化
- 对某些数据的专门处理, 如时序.
三. 小结
和大部分的Python的强化数据处理的多个流程的库一样, ydata-profiling还是有点粗糙和过于简单, 但是作为jupyter notebook的一个数据快速预览的组件, 依然还是不错的选择.
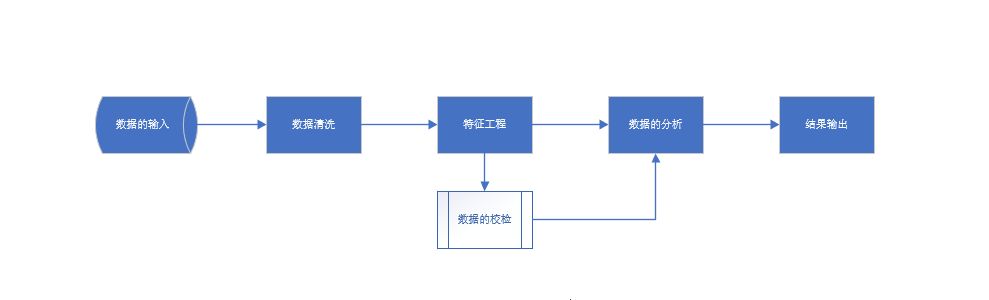
在数据处理的全流程上, python已经形成完备且强大的生态体系.
简单来看:
- 数据输入, 清洗, 特征, pandas
- 数据的特征提取, 模型, 算法, sklearn
- 数据的可视化, matplotlib
- 前端数据交互, streamlit
- 一站式代码-数据-分析编辑工具, jupyter notebook
- .....
尽管各个独立模块在自身相关领域已经非常之强大, 但是还是不够, 因为还是太复杂, 相关操作, 还需要简化("傻瓜化"), 之前介绍的Pandas GUI 操作框架 D-Tale简单使用 | Lian (kyouichirou.github.io), 尽管pandas已经非常易用, 但是还是不够简单, 还无法实现通过鼠标简单点击(极少的代码)即可得到所需的内容, 类似于excel一样, 实现复杂与简单的完美组合.
没有人会拒绝鼠标.
同时各个模块之间还存在大量的空隙, 例如数据预处理 - 数据可视化. 但是假如对于新手, 相关的可视化操作是相对繁琐的, 假如还需要考虑到美化等操作.
而通常相关操作是伴随而生的, 例如数据概览, 除了数字上的描述之外, 最好辅助于可视化的操作, 数据可视化-Anscombe's quartet | Lian (kyouichirou.github.io).

(图: 人对于不同图形的感知能力)

(图: 不同的图表适用场景)
同样的, GUI操作为主的(数据处理)软件, 如各类BI软件(功能极尽繁杂), 单纯的手动操作也不是很好的选择, 配套的脚本语言因应而生, 例如excel的vba, spss除了自有脚本语言同时还支持python, adobe的JavaScript...
Kanaries/pygwalker: PyGWalker: Turn your pandas dataframe into a Tableau-style User Interface for visual analysis (github.com), pygwalker, 一款以Tableau为目标的开源库, 显然很多开发者也看到了BI领域的机会, 尽管Tableau, PowerBI为代表的BI软件看似无比强大, 但是其功能之繁杂和臃肿(某种程度这些软件正在让很多简单事情复杂化), 足以让很多尝试者望而生畏(价格也是个大因素).