一. 前言
为数据处理(提供数据清洗, 计算, 可视化输出等全栈式服务)提供GUI的操作方式是目前python数据处理的一个有趣的方向.
有了代码为什么还需要引入GUI呢? 很简单, 懒...., 并不是希望所有的操作都是基于代码层一步步推进的, 也希望可以通过鼠标简单点击即可完成.
尝试了不少的这些库/框架, 这些库有基于pyqt, 也有基于web的, 但是整体的使用体验都相对较差(各种错误频出).
D-Tale是相对在功能上完整的, 操作逻辑较为明晰, 基于web的框架.
man-group/dtale: Visualizer for pandas data structures (github.com)
What is it?
D-Tale is the combination of a Flask back-end and a React front-end to bring you an easy way to view & analyze Pandas data structures. It integrates seamlessly with ipython notebooks & python/ipython terminals. Currently this tool supports such Pandas objects as DataFrame, Series, MultiIndex, DatetimeIndex & RangeIndex.
- 基于 Flask back-end and a React front-end
- 意图将 notebooks & ipython 整合到一个终端之下.
- 目前基于pandas
Origins
D-Tale was the product of a SAS to Python conversion. What was originally a perl script wrapper on top of SAS’s insight function is now a lightweight web client on top of Pandas data structures.
起源于SAS, 效仿SAS的
perl脚本的实现, 迁移到怕python上基于pandas的实现.
二. 基本操作
2.1 安装
强烈建议在虚拟环境下尝鲜.
# conda activate test_env
pip install dtale
需要依赖的安装包非常多, 建议使用国内镜像
2.2 简单使用
在终端上, 打开python
python
Python 3.10.6 | packaged by conda-forge | (main, Oct  7 2022, 20:14:50) [MSC v.1916 64 bit (AMD64)] on win32
Type "help", "copyright", "credits" or "license" for more information.
>>> import dtale
>>> dtale.show(open_browser=True)
http://DESKTOP-F6VO5U4:40000/dtale/main/1
>>>
注意, 执行相对较慢, 需要等待一会
执行上述命令, 将会自动打开浏览器
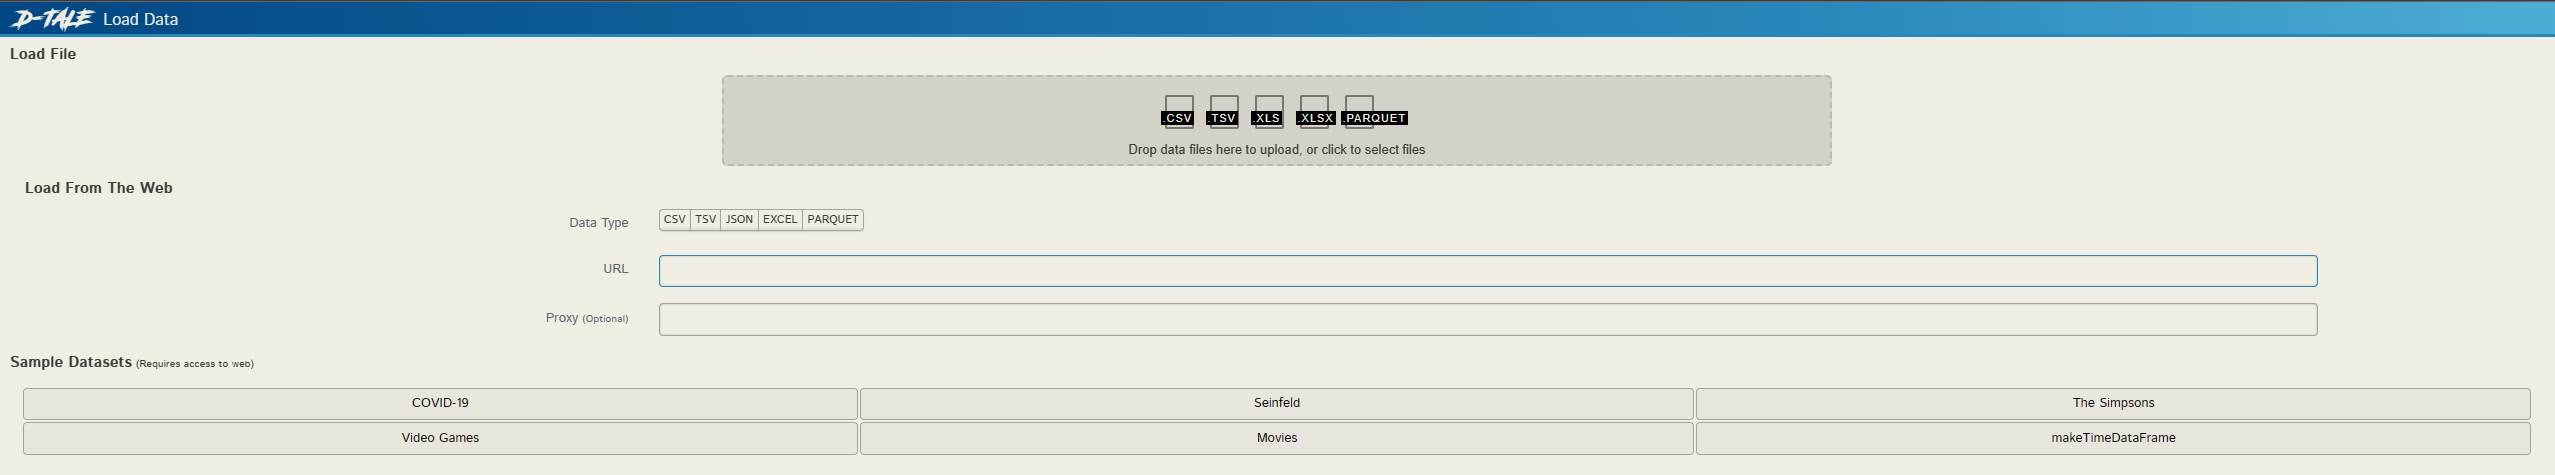
拖拽文件到这里即可
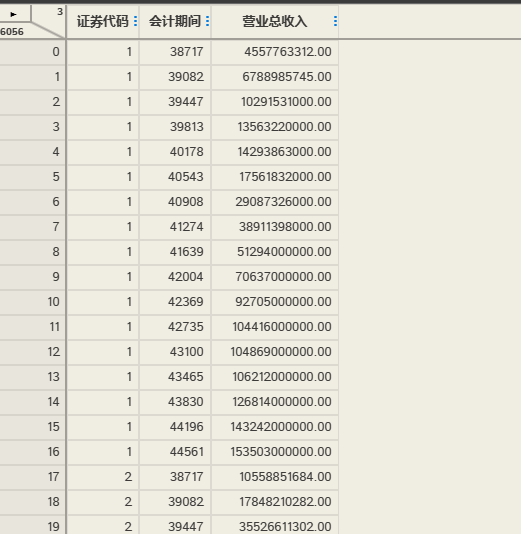
载入数据(时间内容被转换了)
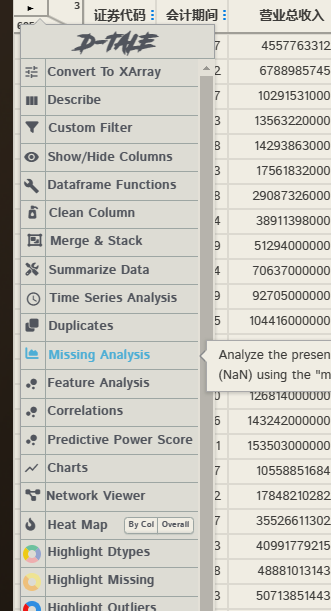
提供了数据处理中高频操作, 例如数据清洗, 聚合等, 也支持数据可视化操作.
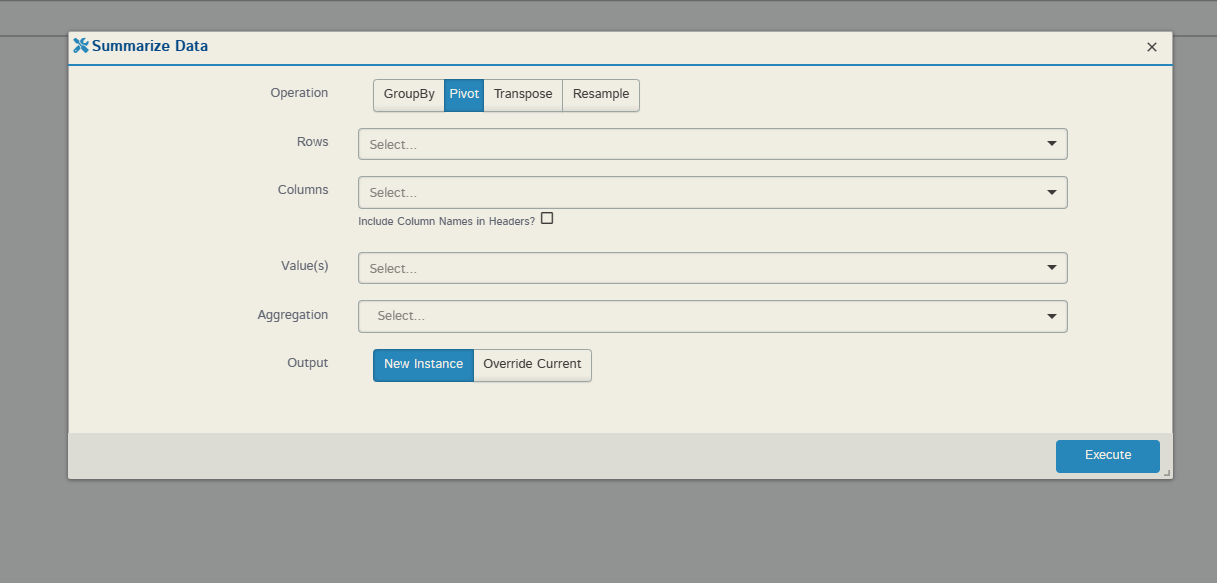
聚合操作.
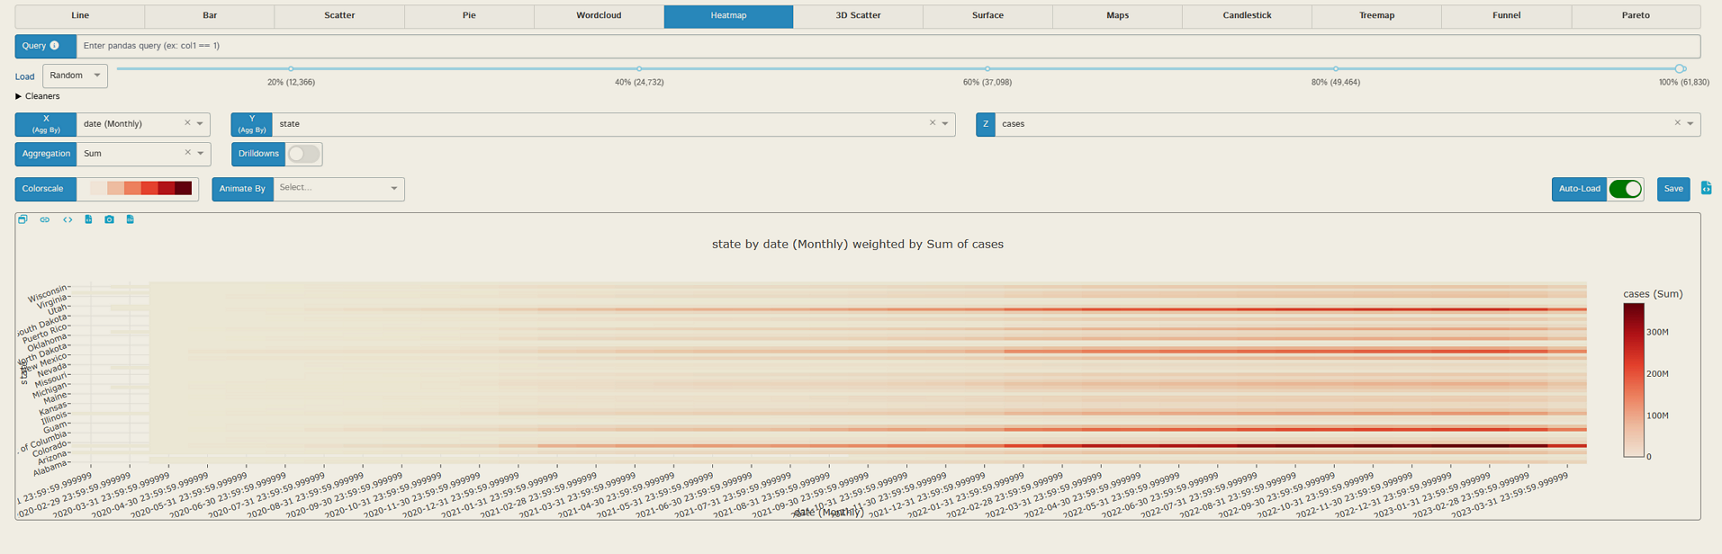
数据可视化(heatmap, 新冠美国各州的病例数量, 月度汇总)
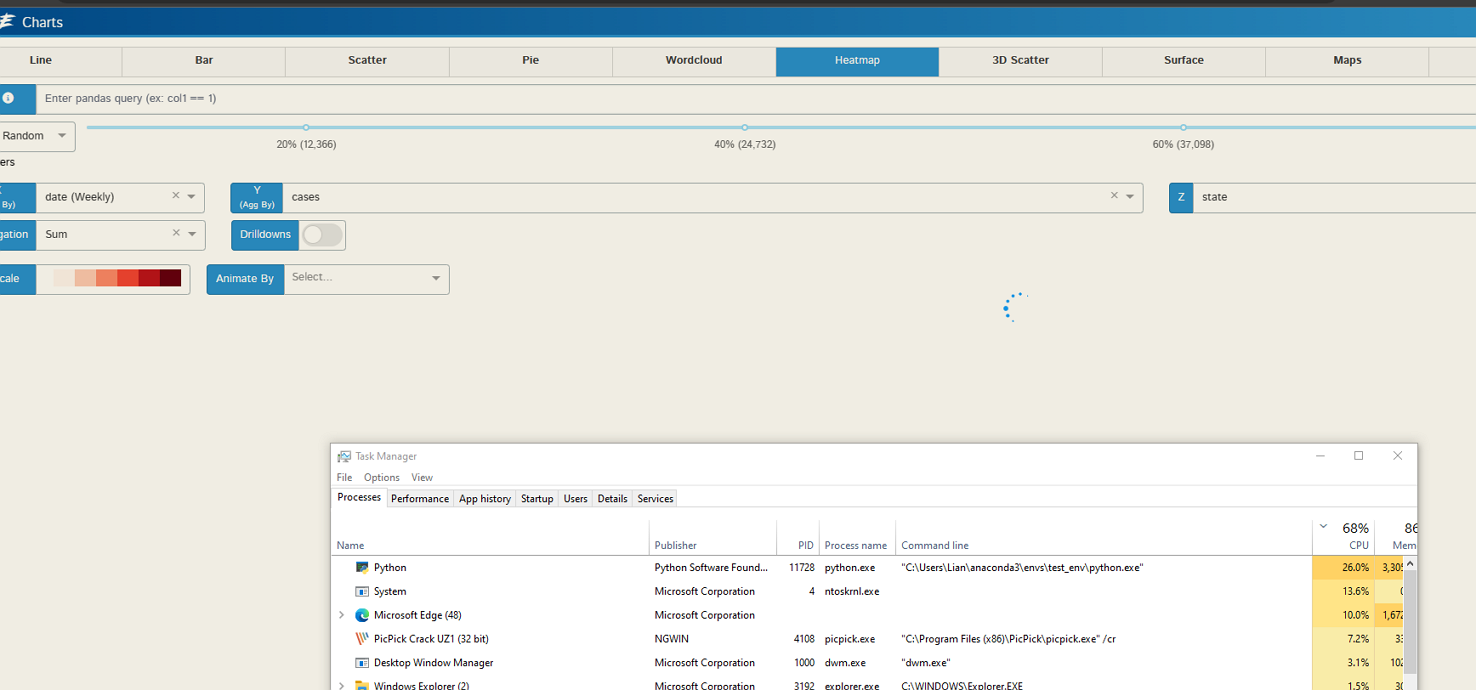
假如你选错了值, 操作界面很多时候并没有提示, 而是一直处于高负载.
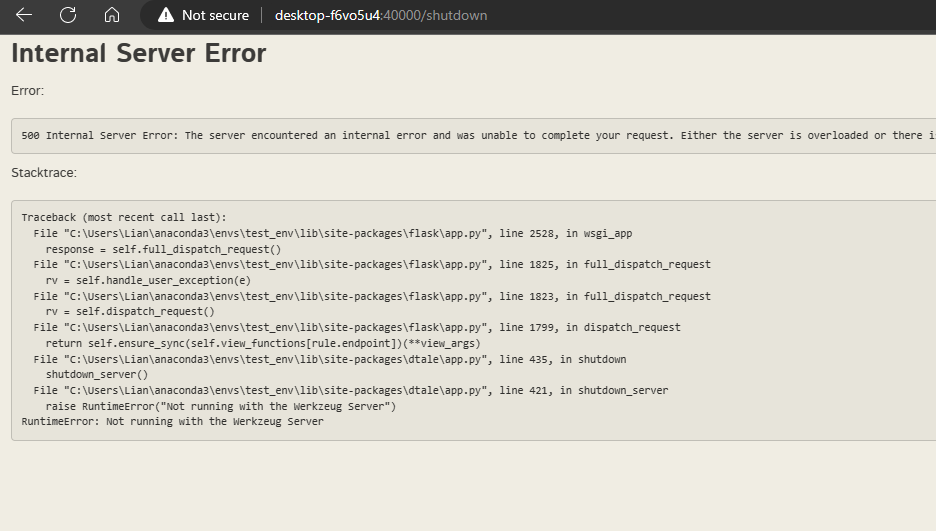
shutdown, error
三. 小结
- 功能基本实现整合(但是操作界面并不友好)
- 和实际的操作环境还是差异很大的, 实际使用流程, 其操作方式远没有
jupyter notebook这些逐层推进来的流畅. - 还是存在不少的问题, 在使用中, 各种错误的出现.
- 基于web, 方便部署, 对于pandas不是很熟练, 但是希望使用pandas, 这是个不错工具.
数据可视化的GUI操作, 基于pyqt(使用matplotlib, seaborn绘图)
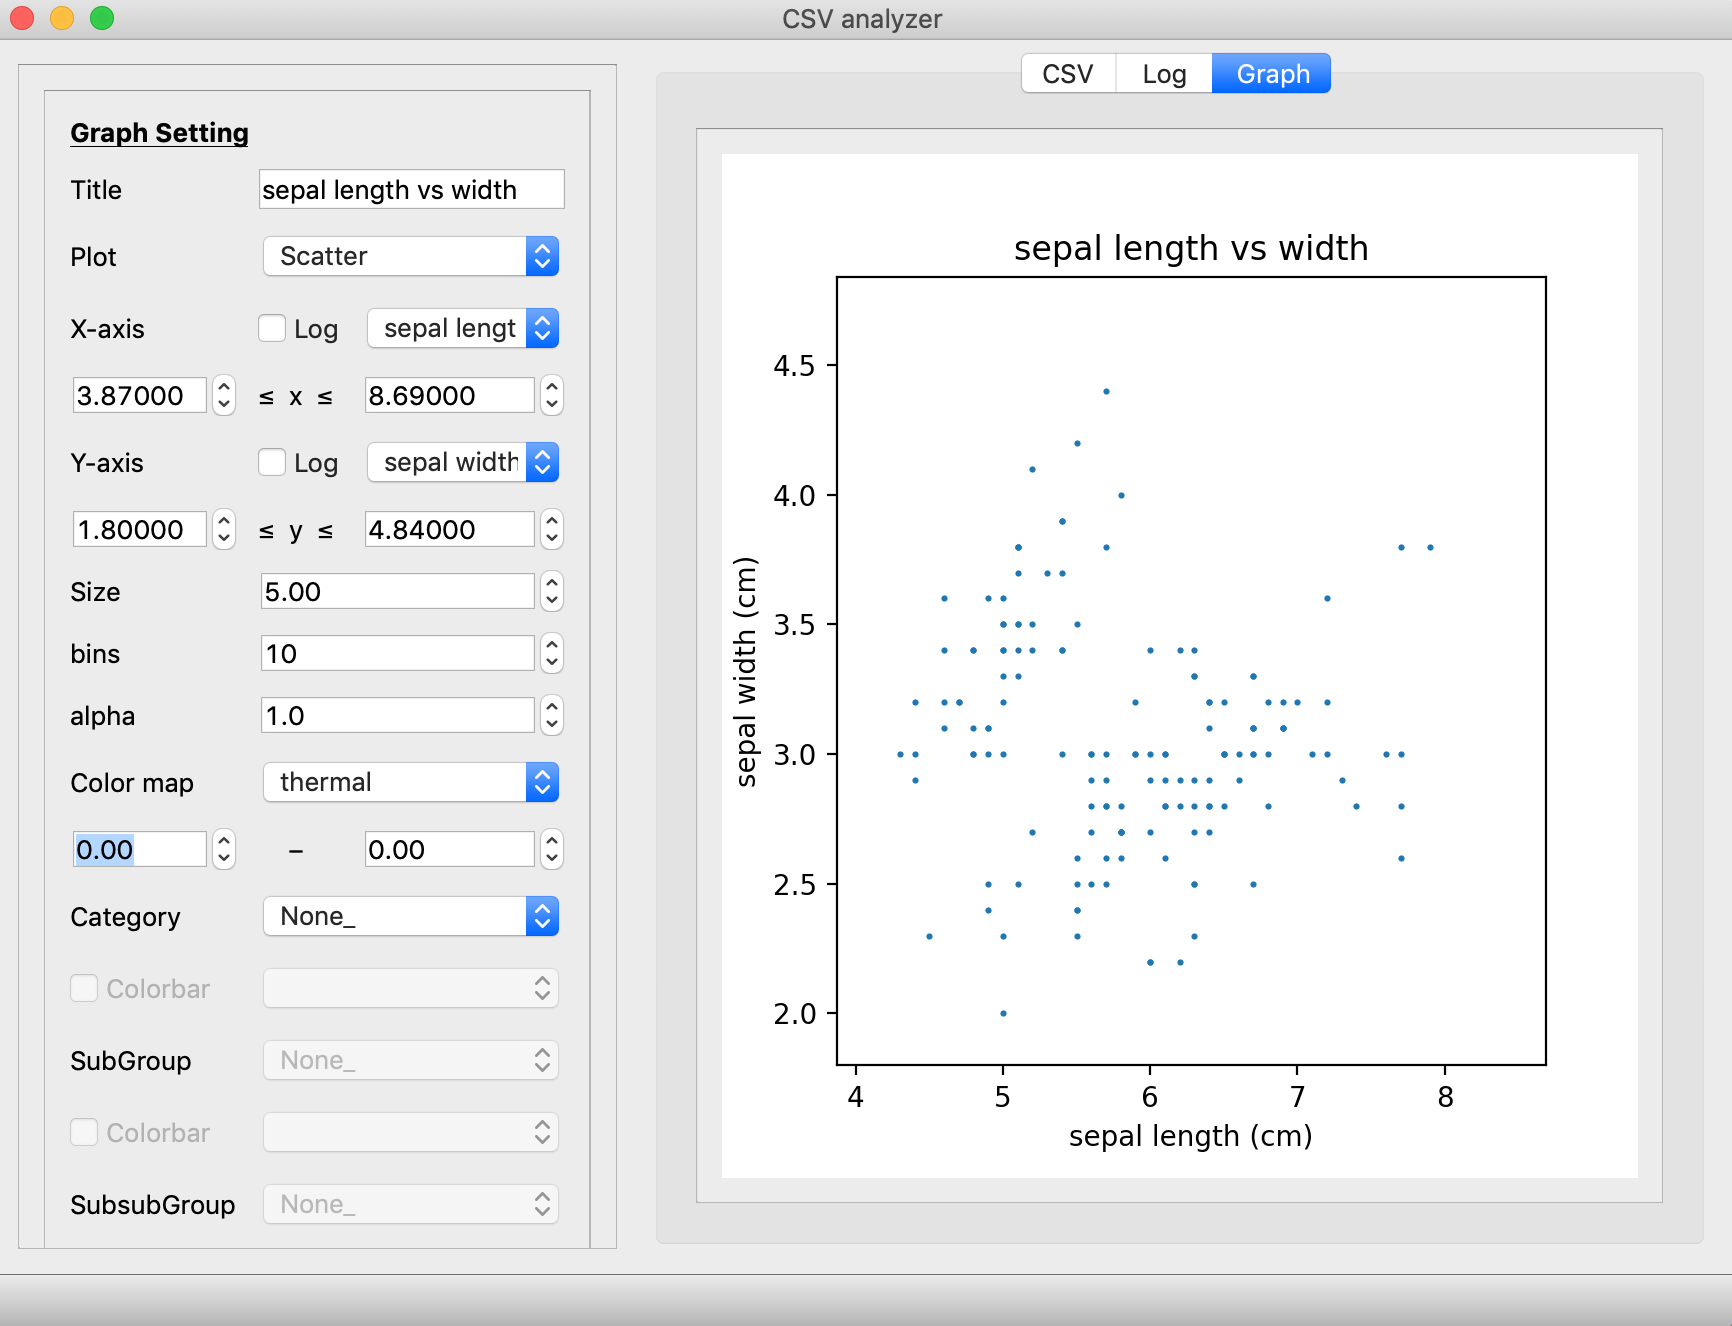
但是使用体验也不是很好.
综上, 以上GUI操作, 虽然貌似让事情简化, 但是实际体验中, 多少不适, 失去了python的灵活, 要去适应特定的操作逻辑, 但是换来的提升和效果却并不是很明显, 虽然以上项目尚成熟, 但是却是提供有趣的探索和实现思路,
尝试了多种类型的工具, 但还是没有jupyter notebook那种流水线式(数据载入, 甚至于采集, 各种角度的数据预览, 数据的清洗, 数据的聚合, 可视化 ...拟合..拟合效果评估....), 一干到底的流畅操作感觉.