一. 问题
构造数据
| a | b |
|---|---|
| aa | 1 |
| ab | 1 |
| ac | 2 |
This option Uses this equation Standard Error Standard Deviation Standard Error
Where:
s = series number
i = point number in series s
m = number of series for point y in chart
n = number of points in each series
yis = data value of series s and the ith point
ny = total number of data values in all series
Standard Deviation
Where:
s = series number
i = point number in series s
m = number of series for point y in chart
n = number of points in each series
yis = data value of series s and the ith point
ny = total number of data values in all series
M = arithmetic mean
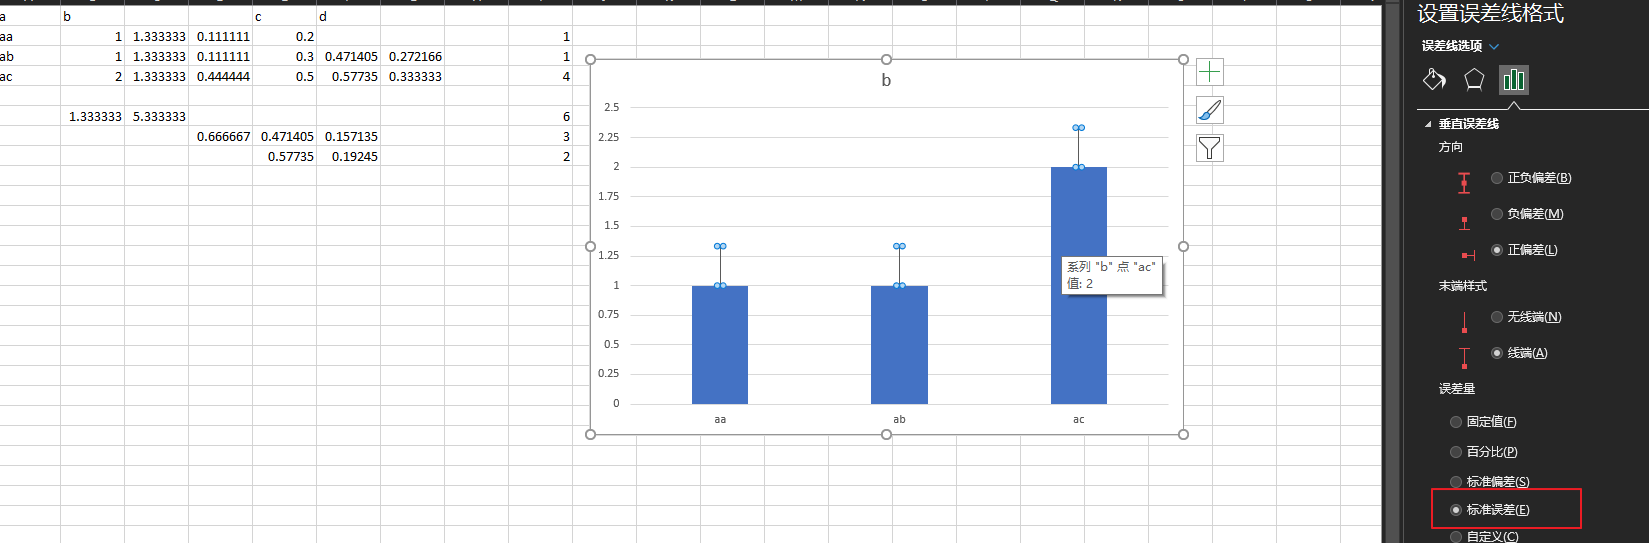
用这个上述的数据, 首先是手动计算这个标准偏差
F3=STDEV.S(B2:B4)
S. E =F3/SQRT(3)
注意, 这里使用的计算标准偏差使用的时STDEV.S不是STDEV.P(经过测试, S得到的数据结果是和excel绘制的标准误差线是一致的).
二者的差异
-
STDEV.S
基于样本估算标准偏差
-
STDEV.P
计算基于以参数形式给出的整个样本总体的标准偏差
标准误差(standard error)的计算
其中
- S.D为标准偏差(
standard deviation), - n为样本的数量
按照上述的计算方式, 来执行, 和excel绘制的误差线完全契合.
但是微软给出的文档中的内容, 标准偏差的计算没什么疑问, 但是这个标准误差这里的计算方式(或者说写法)就有那么一点问题.
yis = data value of series s and the ith point
但是计算流程
不清楚微软这么写的方式, 也许微软写这个的时候认为:
二. 其他
Standard deviation: Quantifies the variability of values in a dataset. It assesses how far a data point likely falls from the mean.
Standard error: Quantifies the variability between samples drawn from the same population. It assesses how far a sample statistic likely falls from a population parameter.
首先 从英文名字来讲 标准偏差是standard deviation deviation有"离差"的意思. 标准偏差表征的是数据的离散程度; 而标准误差的英文名是standard error 表征的是单个统计量在多次抽样中呈现出的变异性. 可以这样理解 前者是表示数据本身的变异性 而后者表征的是抽样行为的变异性.
- Difference Between Standard Deviation and Standard Error - Statistics By Jim
- 标准差 标准误 标准误差 ? ? ? - 知乎 (zhihu.com)
注: 大量的统计术语由于汉语翻译时语境(语义)相近, 导致很多内容的表述出现混乱, 尽量中英搭配出现.