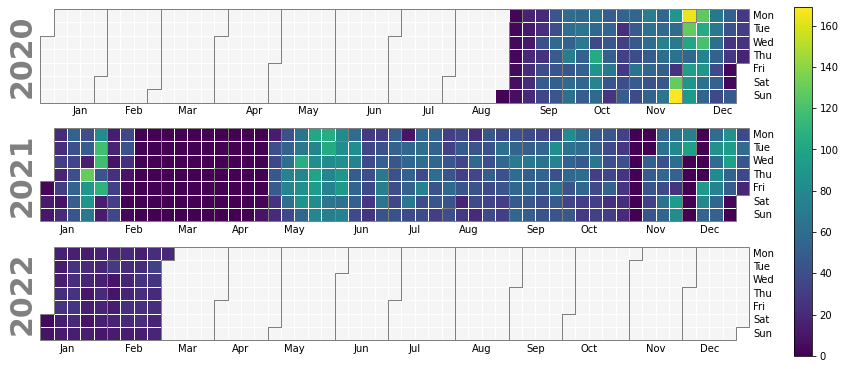
Calplot creates heatmaps from Pandas time series data.
Plot Pandas time series data sampled by day in a heatmap per calendar year using matplotlib.
import pandas as pd
import calplot
df = pd.read_excel(r"日历热图.xlsx")
df.drop('d_key', axis=1, inplace=True)
df.index
RangeIndex(start=0, stop=461, step=1)
df.info()
<class 'pandas.core.frame.DataFrame'>
RangeIndex: 461 entries, 0 to 460
Data columns (total 2 columns):
# Column Non-Null Count Dtype
--- ------ -------------- -----
0 d_date 461 non-null datetime64[ns]
1 sku_sum 461 non-null int64
dtypes: datetime64[ns](1), int64(1)
memory usage: 7.3 KB
Signature:
df.set_index(
keys,
drop: 'bool' = True,
append: 'bool' = False,
inplace: 'bool' = False,
verify_integrity: 'bool' = False,
)
df.set_index(['d_date'], inplace=True)
df.info()
<class 'pandas.core.frame.DataFrame'>
DatetimeIndex: 461 entries, 2020-08-30 06:48:07 to 2022-02-28 02:19:39
Data columns (total 1 columns):
# Column Non-Null Count Dtype
--- ------ -------------- -----
0 sku_sum 461 non-null int64
dtypes: int64(1)
memory usage: 7.2 KB
df.index
DatetimeIndex(['2020-08-30 06:48:07', '2020-08-31 08:48:44',
'2020-09-01 03:22:57', '2020-09-02 05:22:20',
'2020-09-03 00:47:00', '2020-09-04 06:03:27',
'2020-09-05 07:44:57', '2020-09-06 04:32:15',
'2020-09-07 00:12:22', '2020-09-08 00:41:44',
...
'2022-02-19 00:37:46', '2022-02-20 04:25:20',
'2022-02-21 00:48:09', '2022-02-22 03:08:56',
'2022-02-23 00:39:48', '2022-02-24 00:11:49',
'2022-02-25 00:24:41', '2022-02-26 02:12:47',
'2022-02-27 01:49:16', '2022-02-28 02:19:39'],
dtype='datetime64[ns]', name='d_date', length=461, freq=None)
df.head()
sku_sum
d_date
2020-08-30 06:48:07 1
2020-08-31 08:48:44 2
2020-09-01 03:22:57 3
2020-09-02 05:22:20 4
2020-09-03 00:47:00 3
# 注意这里的index设置和set_index之间还是有所差异的, 设置index, 使用这种方法
# 设置时间序列的index
# 注意可能偶尔出现异常, index没有正确转为datetime
# df.index= pd.DatetimeIndex(df['d_date'])
# df.drop('d_date', inplace=True, axis=1)
squeeze
Squeeze 1 dimensional axis objects into scalars.
Series or DataFrames with a single element are squeezed to a scalar. DataFrames with a single column or a single row are squeezed to a Series. Otherwise the object is unchanged.
This method is most useful when you don’t know if your object is a Series or DataFrame, but you do know it has just a single column. In that case you can safely call squeeze to ensure you have a Series.
Parameters
axis{0 or ‘index’, 1 or ‘columns’, None}, default None
A specific axis to squeeze. By default, all length-1 axes are squeezed. For Series this parameter is unused and defaults to None.
Returns
DataFrame, Series, or scalar
The projection after squeezing axis or all the axes.
pd.DataFrame([list(range(5))], columns=["a{}".format(i) for i in range(5)]).squeeze(axis=0)
a0 0
a1 1
a2 2
a3 3
a4 4
Name: 0, dtype: int64
pd.DataFrame([list(range(5))], columns=["a{}".format(i) for i in range(5)]).T
d_series = df.squeeze()
0
a0 0
a1 1
a2 2
a3 3
a4 4
# 将dataframe转为series结构, 同时设置index, 必须是DatetimeIndex格式
# ts = pd.Series(df['sku_sum'], index=df.index)
d_series.index
DatetimeIndex(['2020-08-30 06:48:07', '2020-08-31 08:48:44',
'2020-09-01 03:22:57', '2020-09-02 05:22:20',
'2020-09-03 00:47:00', '2020-09-04 06:03:27',
'2020-09-05 07:44:57', '2020-09-06 04:32:15',
'2020-09-07 00:12:22', '2020-09-08 00:41:44',
...
'2022-02-19 00:37:46', '2022-02-20 04:25:20',
'2022-02-21 00:48:09', '2022-02-22 03:08:56',
'2022-02-23 00:39:48', '2022-02-24 00:11:49',
'2022-02-25 00:24:41', '2022-02-26 02:12:47',
'2022-02-27 01:49:16', '2022-02-28 02:19:39'],
dtype='datetime64[ns]', name='d_date', length=461, freq=None)
d_series.info()
<class 'pandas.core.series.Series'>
DatetimeIndex: 461 entries, 2020-08-30 06:48:07 to 2022-02-28 02:19:39
Series name: sku_sum
Non-Null Count Dtype
-------------- -----
461 non-null int64
dtypes: int64(1)
memory usage: 7.2 KB
d_series.head()
d_date
2020-08-30 06:48:07 1
2020-08-31 08:48:44 2
2020-09-01 03:22:57 3
2020-09-02 05:22:20 4
2020-09-03 00:47:00 3
Name: sku_sum, dtype: int64
calplot.calplot?
calplot.calplot(
data,
how='sum',
yearlabels=True,
yearascending=True,
yearlabel_kws=None,
subplot_kws=None,
gridspec_kws=None,
figsize=None,
fig_kws=None,
colorbar=None,
suptitle=None,
suptitle_kws=None,
tight_layout=True,
**kwargs,
)
data : Series
Data for the plot. Must be indexed by a DatetimeIndex.
# https://calplot.readthedocs.io/en/latest/
# 注意这里只接受series数据的类型, index必须是DatetimeIndex(注意这里不是直接将时间所在的列使用set_index生成)
calplot.calplot(d_series)