
Buying a newspaper. The spirit of the Ghetto.1902 - Newsvendor model - Wikipedia
一. 前言
1.1 泊松分布
即 poisson distribution, 离散概率分布, 适合于描述单位时间内随机事件发生的次数.
泊松分布, 一般需满足以下四个条件:
- 给定区域内的特定事件产生的次数 可以是根据时间 长度 面积来定义;
- 各段相等区域内的特定事件产生的概率是一样的;
- 各区域内 事件发生的概率是相互独立的;
- 当给定区域变得非常小时 两次以上事件发生的概率趋向于0.
1.2 二项分布
1.2.1 伯努利分布
亦或者成为0 - 1 分布
二项分布是n个独立的成功/失败试验中成功的次数的离散概率分布, 二项分布 其中每次试验的成功概率为p. 这种单次成功/失败试验被称为伯努利试验 而当n = 1时 二项分布就是伯努利分布.
当 n 足够大的时候, 正态分布对于离散型二项分布能够很好地近似.
1.3 正态分布
标准正态分布, 即
1.4 正态与泊松
先要介绍一个重要的公式: 斯特林公式_百度百科 (baidu.com)
- 3 泊松过程 | 应用随机过程 (pku.edu.cn)
- 如何理解正态分布作为二项分布和泊松分布的近似? - 知乎 (zhihu.com)
- 分布逼近 - 知乎 (zhihu.com)
- §2.4 二项分布与泊松分布 - 知乎 (zhihu.com)
- Stirling's Formula的证明 - 知乎 (zhihu.com)
二. 报童问题
报童问题, 即newsvendor problem, 亦或者 Newsvendor Model.
The classic newsvendor problem Arrow, Harris, and Marschak (1951) describes a decision-maker who must decide upon an order quantity in each ordering period, given an unknown demand from a known distribution, such that the risk of over-ordering and under-ordering are balanced. Over the past decades, the field of operations management has seen numerous studies testing analytical models related to inventory management and decision-making under risk in laboratory experiments only to discover the lack of " rationality" in the human decision-making processes. However, behavioral studies on the newsvendor problem show that participants in a relatively simple decision-making scenario significantly deviated from the decisions that optimized profits.
- 订货数量(每个特定区间周期).
- 不确定需求.
- 已知的分布(历史数据反推).
- 库存管理.
- 报童问题是多种需求(库存)问题的简化模式.
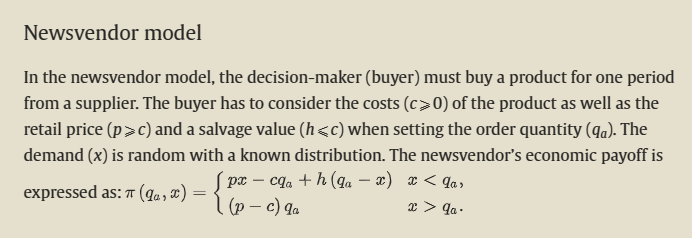
简而言之, 商人一天(每天)应该订购多少报纸才能实现预期效益(E)最大化的问题? 更简单就是, 报纸定多了卖不完, 定少了不够买.
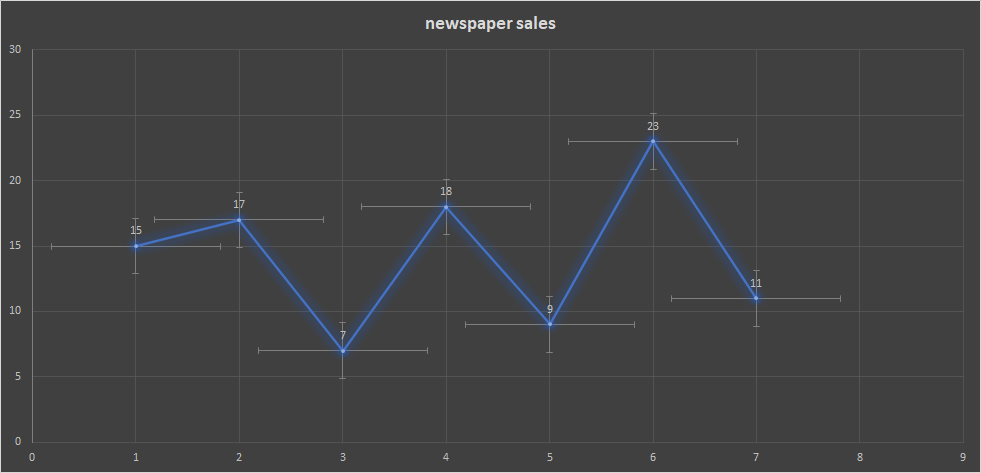
假设存在历史销售数据(如企业历史积累的数据), 其中的部分, 每天销售的报纸数量如下, 每7天一个周期
| date | quantities |
|---|---|
| 1 | 15 |
| 2 | 17 |
| 3 | 7 |
| 4 | 18 |
| 5 | 9 |
| 6 | 23 |
| 7 | 11 |
2.1 模型构建
参数解析:
报纸的订购每份价格 c: 0.5
报纸的零售每份价格 q: 1
报纸的每份残值 s: 0.05 (当废纸处理)
其中 q > c >> s
每天销量为: x
每天订购的数量为: d
即, 使得函数g(d)的取值达到最大值.
2.2 问题简化
在实际的业务场景很多时候, 缺货是需要优先考虑的, 特别是在业务高度成熟之后, 因为对于类似于Amazon等电商平台, 热销的产品缺货将可能会导致很多问题, 如搜索权重被大幅度调低(这种变化很多时候补货后也难以挽回).
隐含额外目标: 保证供应充足, 宁愿超出一定数量, 也不希望出现缺货的情形.
即, 模型需要实现两个主要目标:
- 收益最大化
- 最大程度满足市场需求
故而,可以先将问题局限在, 商人需要每天备多少的报纸才能满足市场的需求, 在这个基础上对订购数量进行调整.
以下仅仅是演示, 假设数据满足的分布, 并不说上述假设数据满足以下的分布.
2.2.1 离散型
得到上述内容后, 计算
import math
import plotly.graph_objects as go
from plotly.subplots import make_subplots
import pandas as pd
sales = [
15,
17,
7,
18,
9,
23,
11
]
avg = sum(sales) /len(sales) # 14.285714285714286
# 泊松分布概率分布函数
ps = lambda k: (math.e ** (- avg) * avg ** k) / math.factorial(k)
data = [ps(i) for i in range(1, 30)]
df = pd.DataFrame()
df['quantities'] = range(1, 30)
df['probability'] = data
df.head(3)
| quantities | probability |
|---|---|
| 1 | 0.000009 |
| 2 | 0.000064 |
| 3 | 0.000304 |
# 帕累托累加
df['cum'] = df['probability'].cumsum()
df.head()
quantities probability cum
0 1 0.000009 0.000009
1 2 0.000064 0.000073
2 3 0.000304 0.000376
3 4 0.001084 0.001461
4 5 0.003098 0.004559
# 在quantities = 21时, 满足市场需求的可能性大于0.95
q = df.loc[df['cum'] > 0.95].iloc[0, 0]
21
# 等价于
from scipy.stats import poisson
ls = poisson(avg)
tmp = [ls.cdf(i) for i in range(1, 30)]
# 返回累积概率1-21
ls.cdf(21)
0.9653094499403743
# 多轴方式不要使用官方文档的示例, 会导致绘制第二轴时, 出现问题, 在增加注释和垂直的线时
# 概率分布
trace1 = go.Bar(
x=df['quantities'],
y=df['probability'],
name='probability'
)
# 显示q的垂直线
trace2 = go.Scatter(
x= [q] * 29,
y = df['cum'],
name=str(q),
showlegend=False,
xaxis='x',
yaxis='y2'
)
# 累积曲线
trace3 = go.Scatter(
x =df['quantities'],
y = df['cum'],
name='cum',
xaxis='x',
yaxis='y2'
)
data = [trace1, trace2, trace3]
layout = go.Layout(
# 设置坐标轴的格式 一般次坐标轴在右侧
yaxis2=dict(
anchor='x',
overlaying='y',
side='right'
)
)
fig = go.Figure(data=data, layout=layout)
fig.add_annotation(
x=q,
y=df.loc[df['cum'] > 0.95].iloc[0, 2],
text="> 95%",
# 设置以第二轴来添加注释
yref="y2",
# 颜色
font_color='red',
# 显示注释箭头
showarrow=True,
secondary_y=True,
# 设置为箭头
arrowhead=1
)
fig.update_layout(
width=720,
height=360,
title='probability of newspaper quantities'
)
fig.show()
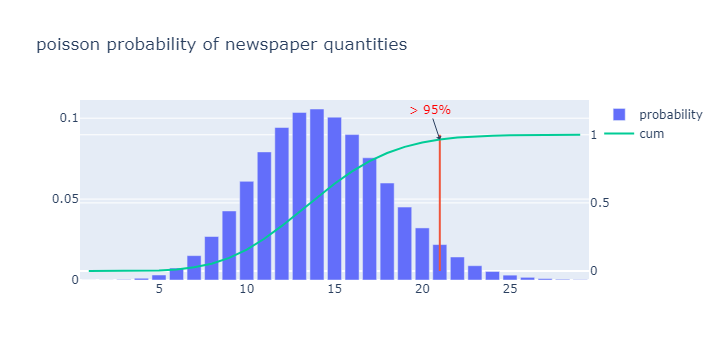
(plotly绘制的是动态可交互的图, 不是静态图)
即, d 的取值在21时, 已经有95%的可能性是满足市场的需求的.
2.2.2 连续型
离散型随机变量
即,
discrete random variable, 如果随机变量X的所有值都可以逐个列举出来, 则称X为离散型随机变量.连续型随机变量
即,
continuous random variable, 如果随机变量X的所有值不可以逐个列举出来, 则称X为连续型随机变量.
假设, 该问题的销量概率密度函数 f(x) 服从正态分布.
from scipy import stats
stats.tstd(sales)
# 5.618845839799182
# 这里需要注意在计算的时候stats.tstd()
# 在这里关于Excel图表中误差线的计算问题所讨论的问题
# STDEV.S, STDEV.P, 即样本偏差还是整体的偏差
# 亦或者, 无偏估计, 有偏估计
np.std(sales)
5.202040416009464, 注意numpy提供的计算, 默认状态, 计算的方式 = STDEV.P
# 需要手动指定
np.std(sales, ddof=1) # 和下面的stats反向操作
5.618845839799182
ddofint, optional
Means Delta Degrees of Freedom.
The divisor used in calculations is N - ddof, where N represents the number of elements.
By default ddof is zero.
# Delta degrees of freedom. Default is 1.
stats.tstd(sales, ddof=0)
5.202040416009464
# 这种计算上的差异, 在其他的api上也同样如此
# 例如方差的计算
x = np.arange(avg - 4 * std, avg + 4 * std, 0.01)
y = stats.norm.pdf(x, avg, std)
px.line(
x = x,
y= y,
width=720,
height=480,
title='probability of newspaper quantities'
)
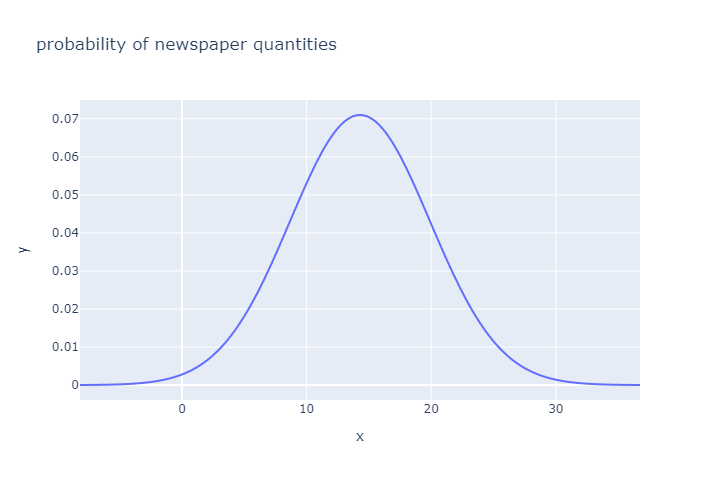
stats.norm.ppf(0.95, avg, std)
# 23.52789324458916
即订货 d 的取值在24时, 满足市场需求的概率超过95%.
代入前面模型中预设的数值计算:
关于积分计算的方式, 注意sympy在这里计算会出现的一些问题.
注意: 这里的代码和其他内容无关, 仅作为备忘
from sympy import integrate, Symbol
from sympy.stats import Normal, density
import math
import numpy as np
from scipy.stats import norm
X = Normal("x", 10, 2.5)
x = Symbol('x')
## 获得正态分布的概率密度函数
ts = density(X)(x)
ts
integrate(density(X)(x), (x, 0, 1))
# 默认状态下不会自动转为浮点数
integrate(density(X)(x), (x, 0, 1)).evalf()
# 0.000127437348324436
9.0111813176641 * math.pow(10, -5) * math.sqrt(2)
# 0.0001274373483244363
integrate(density(X)(x), (x, -np.inf, 1))
## 等价于
norm.cdf(1, 10, 2.5)
# 0.0001591085901575871
# 逆cdf函数
norm.ppf(0.0001591085901575871, 10, 2.5)
# 1.0000000000002185
# 注意区分开离散型和连续型分布的差异
# 这里得到的概率可能性只是概念上的, 并不是和离散型的一样是具体的指向, 某个点-概率这种关系
# 可以认为是参考指标
norm.pdf(1, 10, 2.5)
# 0.00024476077204550875
# 等价于, 直接输入公式来计算
(0.2 * math.sqrt(2) * \
math.pow(math.e, -8.0 *(0.1 - 1) ** 2))/math.sqrt(math.pi)
这里计算g(d)函数的积分时出现问题, 而且很慢, 这里使用scipy的integrate来计算上述的函数积分.
The
scipy.integratesub-package provides several integration techniques including an ordinary differential equation integrator. An overview of the module is provided by the help command:
from scipy import integrate
def part_one(x, d):
return (0.95 * x - 0.45 * d) * stats.norm.pdf(x, avg, std)
def part_tow(x, d):
return 0.5 * d * stats.norm.pdf(x, avg, std)
# 在上面部分已经提及当数据在35左右已经趋近于0, 所以这里的无穷可以直接使用35替代即可
rs = []
for i in range(1, 35):
# quad返回两个值, 一个是计算结果, 一个是误差
# scipy速度非常快
# sympy运行很慢, 对于复杂的函数
rs.append(
integrate.quad(test, 0, i, args=(i, ))[0] +\
integrate.quad(part, i, 35, args=(i, ))[0] )
import plotly.express as px
px.line(
x=range(1, 35),
y=rs,
text=["(" + str(i + 1) + ',' + str(round(e, 2)) + ")" for i, e in enumerate(rs) ],
title='max profit',
width=900,
height=480
)
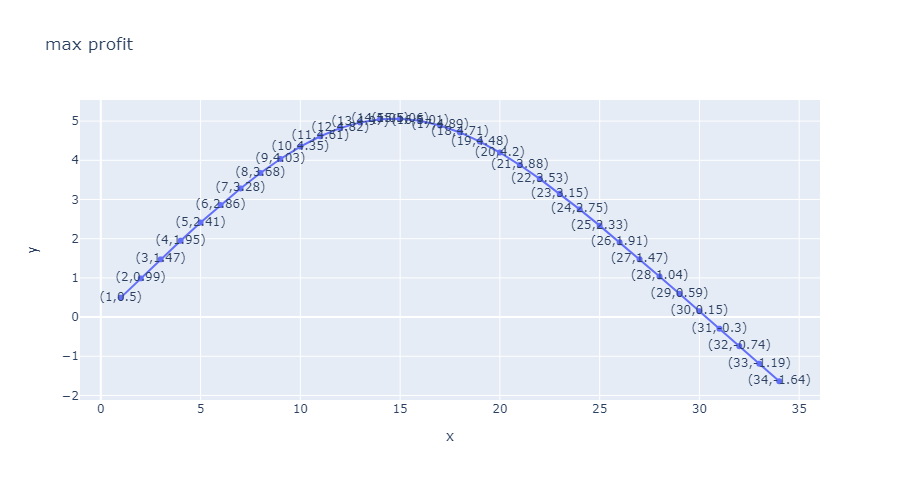
以上述模型假设的数值计算结果:
- 最优解出现在15
- 最大的获益可能为
5.06
# 使用 matlab 来完成
# m的代码风格, JavaScript, vba, mysql的整合
clear;
clc;
mx = 35;
avg = 14.285714285714286;
sig = 5.618845839799182;
x = 0:1:mx;
part_a = @(x, d)(0.95 .* x - 0.45 .* d).* normpdf(x, avg,sig);
part_b = @(x, d)0.5 * d * normpdf(x, avg, sig);
# 声明0填充的数组, 相当于声明一个空数组
results = zeros(mx - 1, 1);
for d = 1:1:mx - 1
results(d) = integral(@(x)part_a(x, d), 0, d) + integral(@(x)part_b(x, d), d, mx);
end
[m_profix, d_point] = max(results);
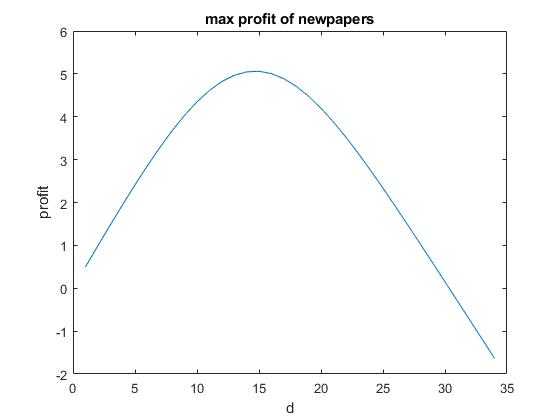
# 5.6188, 15
plot(1:1:mx-1, results);
xlabel('d');
ylabel('profit');
title('max profit of newpapers');
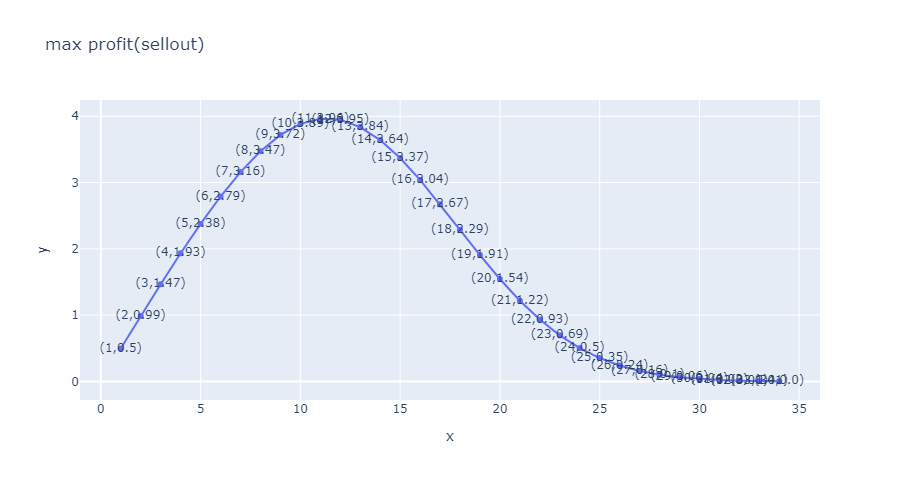
只考虑售罄情况, 最大值出现在11, 最大值为3.96
只考虑无法完全出售的情况
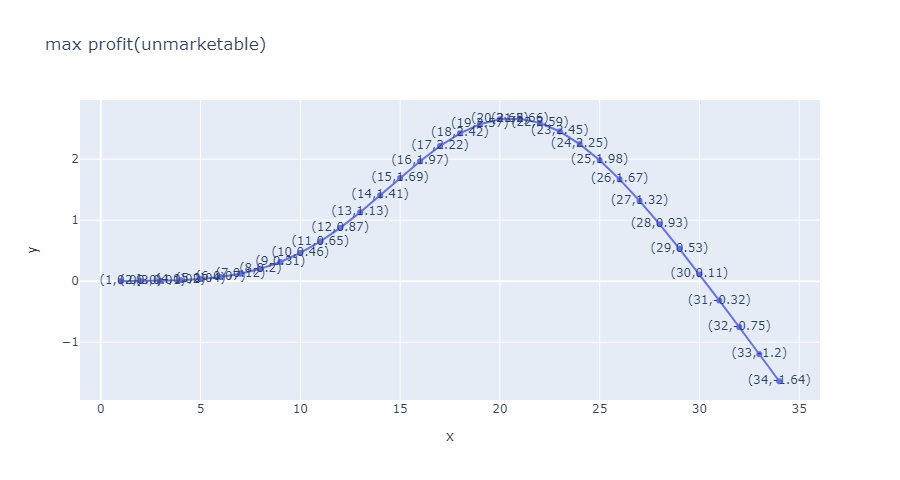
最大值出现在21, 最大利润2.66.
2.2.3 小结
回到最初的方程:
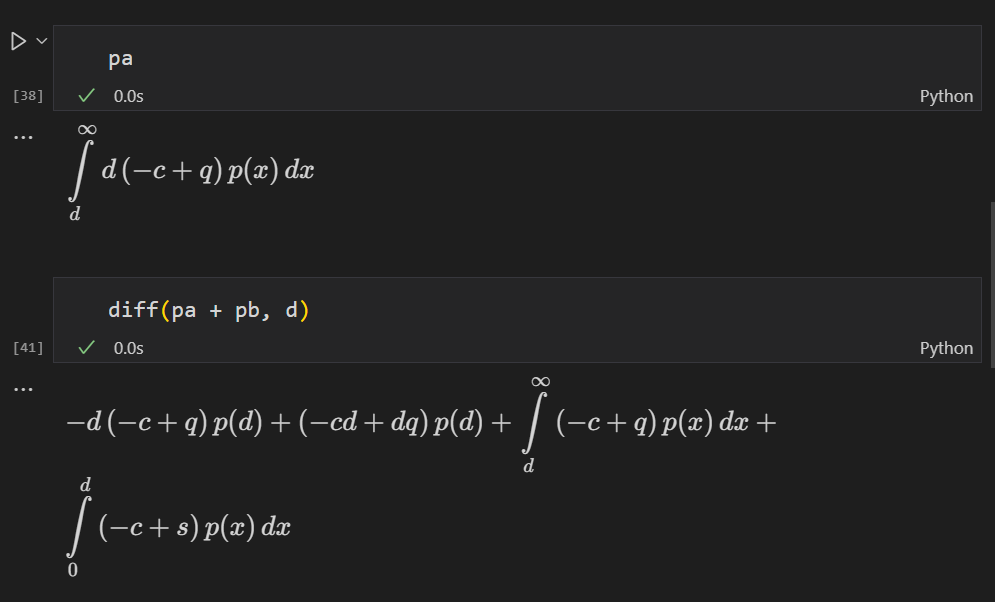
# 利用sympy创建出函数方程
# 但是需要注意sympy只能给出答案, 并不会化简, 需要手动化简
p = Function('p')
x, d, c, s, q= symbols('x d c s q')
pa = Integral((x * q - d * c + (d -x) * s) * p(x), (x, 0, d))
pb = Integral((q - c) *d* p(x), (x, d, +oo))
# 对d进行求导
diff(pa + pb, d)
# 求二阶导
diff(diff(pa + pb, d), d)
# diff(pa + pb, d, d), 多阶求导, 只需要在后面加上求导的参数即可
# 得到的二阶导数
# g''(d) >= 0, 函数g(d)为上凸函数
解得:
# 将数据代入, 最佳的订货数量
F(d) = P = 0.5/0.95
d = stats.norm.ppf(P, avg, std)
# 14.656624483059883, => 15
由于残值在实际中是相对固定的, 波动的主要源自销售价格( q )和成本价格( c ), q / c 的比值越大, 订货策略可以趋于激进, 反之则相反.
同时, 对 F(d) 的最优求解, 实现了模型和实际数据指标之间的联系.
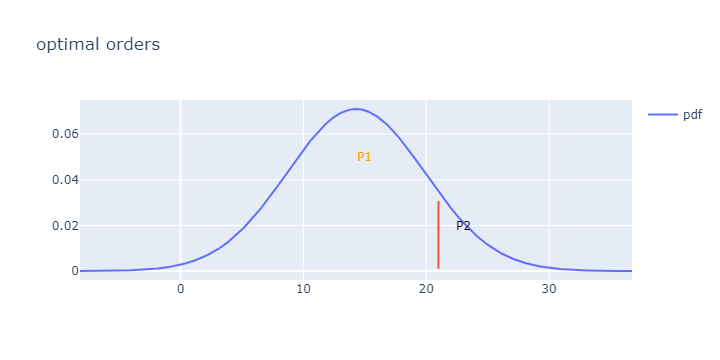
(P1, P2)
trace2 = go.Scatter(
x= x,
y = y,
name="pdf"
)
trace3 = go.Scatter(
x = [21] * 10,
y = [stats.norm.pdf(i, avg, std) for i in range(-2, 21)],
mode='lines',
name='gap',
showlegend=False
)
data = [trace2, trace3]
fig = go.Figure(data=data)
fig.add_annotation(
x=15,
y=0.05,
text="P1",
showarrow=False,
font_color='orange',
)
fig.add_annotation(
x=23,
y=0.02,
text="P2",
showarrow=False,
font_color='black',
)
fig.update_layout(
width=720,
height=360,
title='optimal orders'
)
fig.show()
2.3 扩展
- 增加缺货的惩罚机制(损失), l
- 仓储空间(假设报纸需要中转), i
- 仓储成本(运输成本), ic
- 采购成本和采购量的动态变化, 例如采购
20份为0.5元, 采购10份0.6元, 即采购成本转为为特定的函数C(d).
加入上述内容, 扩展模型, 但是需要注意, 模型是否还适合处理上述的问题.
三. 总结
上述对于历史销售数据的分布假设仅作为演示的示例, 实际的可能出现的分布形式还有很多.
报童模型, 是相对理想的状态, 现实中, 实际远比模型复杂, 需要考虑的变量也更多, 模型不宜生搬硬套.
- 仓库仓储数量是有限的, 尽管销售情况很好, 但是限于仓库的存储能力.
- 产品的生命周期是有限的, 特别是对于快消品而言(如季节性产品), 不能单纯从过往的数据来考虑问题.
- 商人宁愿承受的风险程度, 和投资一样, 不同的风险对应的收益是不尽相同的, 通常而言, 高风险对应高收益, 低风险则反之.
- 商人宁愿承受商品不够卖带来的潜在收益损失(在电商中, 常见的由于备货不足, 销量非常好的商品由于无货, 导致相关的大流量的关键词检索排名下滑(或者在其他场景被推荐的排名大幅下滑), 甚至补货后, 排名也无法回到之前的高位, 额外的备货实际上需要有一定额度来应对可能出现的备货不足问题, 实际的一部分商品无法出售带来的损失相当于为搜索高排名的产品购买缺货的保险支出).
- 补货的时间差带来的额外风险.
- 补货需要考虑不同时期的订购商品的价格不一样(通常不同的订货数量也不一样的采购价格).
- 资金是有限的, 但是投资确是不确定的, 需要考虑投资回报收益(也许单一模型调整的参数已是最优, 但是不是全局最优).
- ....
四. 参考
大部分的处理方式都是一样的, 只是在数学模型参数上一些表述上的差异而已.
- Microsoft PowerPoint - ORF 411 15 Newsvendor problem
- <数学模型 - 4th edtion>, 姜启源
- 报童问题 (The Newsvendor Problem)_胡拉哥的博客-CSDN博客
- [IEOR 4000: Production Management_lect_04.pdf (columbia.edu)](lect_07.pdf (columbia.edu))
- Newsvendor problem - Cornell University Computational Optimization Open Textbook - Optimization Wiki
- Newsvendor model - Wikipedia
